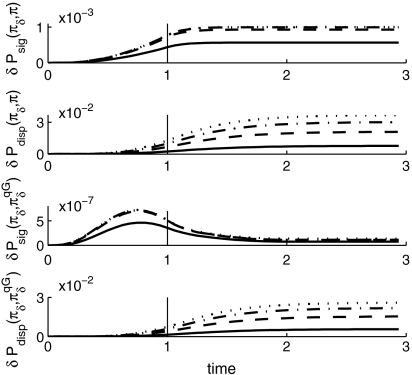
Fig. 1.
(Upper Two) Signal and dispersion parts of  from Eq. 7 measuring the sensitivity of the tracer model Eq. 26 to the ramp-type perturbation, δfU(t). (Lower Two) Signal and dispersion parts of
  from Eq. 7 measuring model error due to the use of quasi-Gaussian FDT from Eqs. 10 and 11 for predicting climate response to the same ramp-type perturbation. The vertical line shows when the perturbation, δfU(t), stopped changing at the rate 5% per unit time and became constant leading to a new climate. The solid line corresponds to the coarse graining with only 1 mode; dashed line, 3 modes; the dash-dotted line, 6 modes; and the dotted line, 10 modes.

