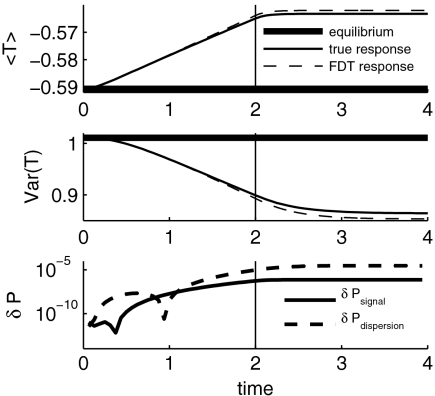
Fig. 2.
High skill of FDT in predicting the response to the ramp-type perturbations, δfU(t). (Upper) The unperturbed equilibrium and perturbed mean tracer as functions of time as well as the FDT prediction obtained using the kicked perturbation experiment; (Middle) the same as Upper but for the variance of the tracer; (Lower) the signal and dispersion parts of  from Eq. 7. The vertical line shows when the perturbation, δfU(t), stopped changing at the level 2% per unit time and became constant leading to a new climate.

