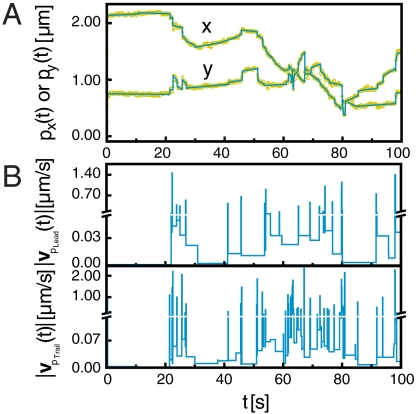
Fig. 1.
Analysis of the two-point velocity profiles of the ΔfliM mutant. (A) x and y position of one focus (px(t) and py(t)) as a function of time. Yellow symbols show raw data and cyan lines indicate the denoising regression (threshold = 2 pixels). (B) Velocity amplitudes (|vpLead(t)| and |vpTrail(t)|) of foci pLead and pTrail as a function of time. Velocity amplitudes are calculated from the regression data.

