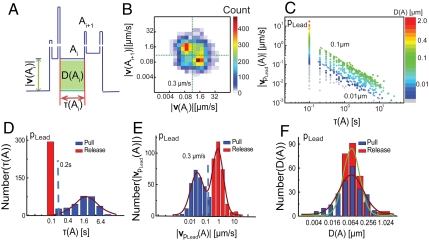
Fig. 3.
Analysis of the velocity of leading pole pLead reveals distinct pulls and releases. (A) Schematic definition of an action in the velocity profile: For the ith action Ai, |vpLead(Ai)| is the velocity amplitude, τ(Ai) is the duration time, and D(Ai) is the total displacement. (B) 2D histogram of the velocity amplitude of connected actions (Ai and Ai+1) for leading pole pLead. (C) Velocity amplitude |vpLead(A)| as a function of duration τ(A) for the leading pole pLead in the trajectory of a single ΔfliM bacterium (N = 12,000 points); the color scale indicates the total displacement D(A). The two dashed lines (slope = -1.0) are guides to the eye indicating total displacements between 0.01 μm and 0.1 μm. (D) Histogram of the duration τ(A). The dashed line indicates the time threshold (τc = 0.2 s) separating release actions (red bars) from pull actions (blue bars). (E) Histogram of the velocity amplitude |vpLead(A)|. The dashed line indicates the velocity threshold (|vpLead,c| = 0.3 μm/s) separating release actions (red bars) from pull actions (blue bars). (F) Histogram of the displacement D(A) of release actions (red bars) and of pull actions (blue bars). In D–F the line is the Gaussian fit to the distribution.

