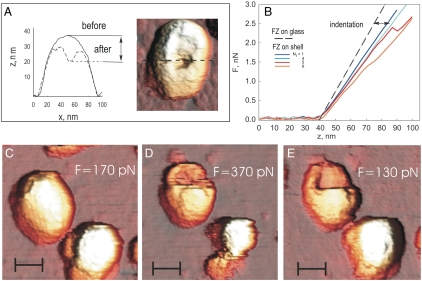
Fig. 3.
Fracturing prohead shells. (A) Cross-section of the topography of a prohead before and after applying load to the central part of the shell. Subsequent imaging shows a hole in the shell. Loading cycle approximately 10 ms. (B) Sequence of 10-ms force-distance curves recorded from one prohead; Ni, number in the series. A discrete breaking event occurs at Ni = 5. (C) Imaging with 170 pN of maximal force. (D) Shell breaks during imaging with 370 pN. (E) Subsequent imaging at 130 pN shows fractured prohead shell. (Scale bar: 35 nm.) Scan direction: fast, horizontal; slow, top to bottom.

