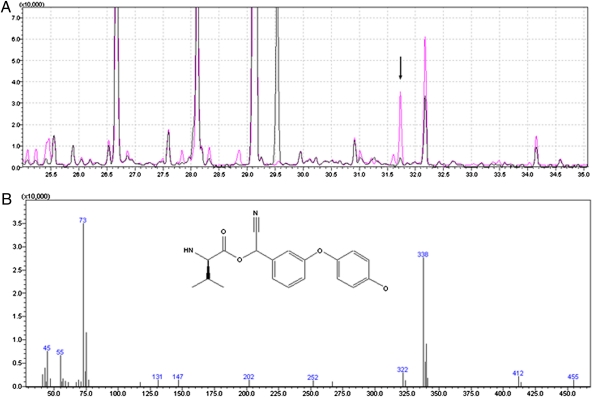
Fig. 1.
Untargeted GC-MS analysis of tau-fluvalinate metabolism. (A) Chromatograms for controls (black) and for tau-fluvalinate treatments (red). These are compounds extracted from frass of control insects and of tau-fluvalinate–treated insects. Products were BFSTA-derivatized and then analyzed by GC-MS. (B) Mass spectrum of the arrow-marked red peak specific for the tau-fluvalinate treatments. The insert represents the fragment of tau-fluvalinate metabolite (338 Da).

