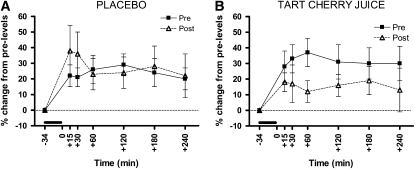
FIGURE 1 .
Plasma F2-isoprostane responses to the I/R trial in healthy older adults. Values are means ± SEM, n = 11, for percent change from baseline levels pre- and postplacebo (A) and tart cherry juice (B). The heavy dark line denotes the time of forearm I/R. The I/R trial increased plasma F2-isoprostane levels (main effect of time, P < 0.05). The tart cherry juice intervention decreased the F2-isoprostane response to the I/R trial: treatment × trial interaction, P < 0.05, and treatment × trial × time point interaction, P < 0.01.

