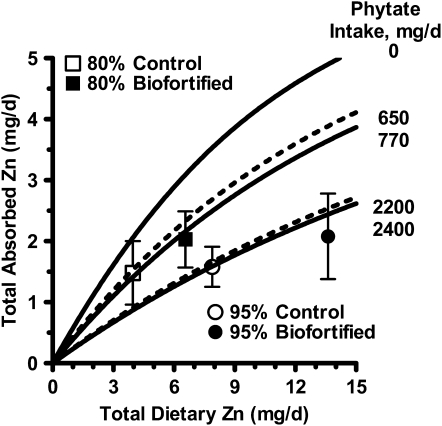
FIGURE 2 .
Two-dimensional plot of measured absorption data and prediction curves derived from a trivariate model of Zn absorption as a function of dietary Zn and phytate intake (5). Prediction curves for the mean daily phytate intakes of each of the 4 conditions are shown. The zero phytate curve is provided for reference. Also shown are the mean ± SD measured Zn absorptions for each of the 4 study women who consumed 95% (n = 14) or 80% (n = 13) extracted control and Zn-biofortified wheat. In each case, the measured absorption agreed very well with the model's prediction (Table 1).

