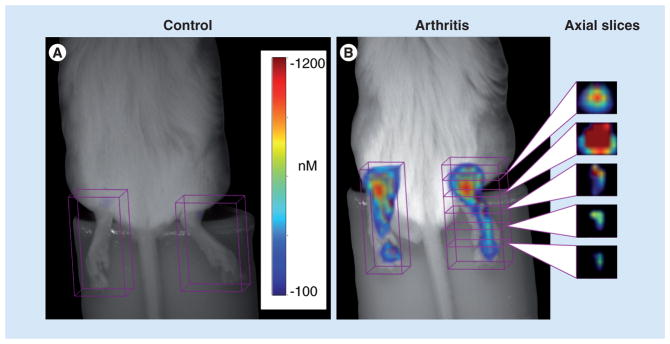
Figure 1. White light images of the bilateral ankles of mice without (A) and with (B) collagen antibody-induced arthritis with superimposed 3D near-infrared fluorescence tomography signal after injection with a near-infrared dye.
Representative axial slices through an affected hind paw are shown. Signal is greatest around the ankle (first and second slices from the top) and decreases at the mid foot and toes.
Adapted from [11] with permission from Arthritis Research & Therapy.

