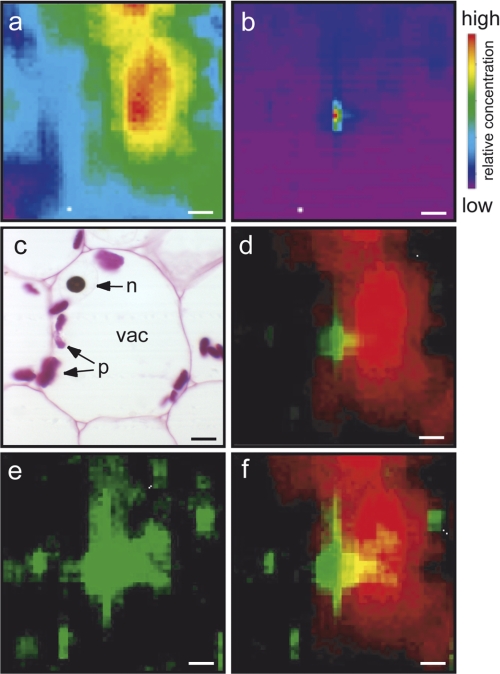
FIGURE 2.
Elemental μXRF mapping on cryosections of pea embryos. a, mapping of potassium. b, mapping of iron. c, pea cell from resin-embedded embryo, stained with Perls/DAB and Schiff to reveal iron and carbohydrates, respectively. n, nucleus, vac, vacuole, p, plastids. d, merge of potassium (red) and iron (green) signals. e, iron fluorescence intensity with modified fluorescence levels to reveal minor pools of iron. f, merge of potassium fluorescence (red) with the readjusted iron fluorescence from e. The synchrotron beam (size: 2.5 × 3.5 μm) was set at 7200 eV. Bar = 10 μm.

