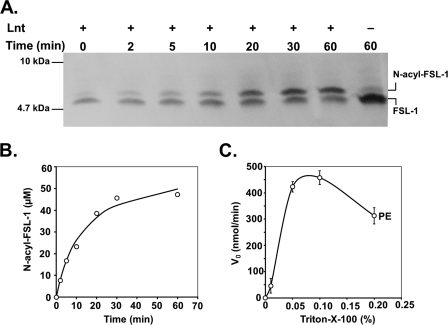
FIGURE 5.
Lnt N-acylation activity with FSL-1. A, Lnt (10 nm) was added to a reaction mixture composed of polar lipid extract from E. coli (500 μm) and FSL-1 (60 μm). Samples were removed at time intervals from the reaction and analyzed by Tricine-SDS-PAGE and immunoblotting against the biotin tag of FSL-1. B, concentration of N-acylated FSL-1 in the reaction is represented as a function of time. C, initial rates of N-acylation activity under standard assay conditions (see “Experimental Procedures”) were strictly dependent on the presence of detergent and are displayed as function of the concentration of Triton X-100.

