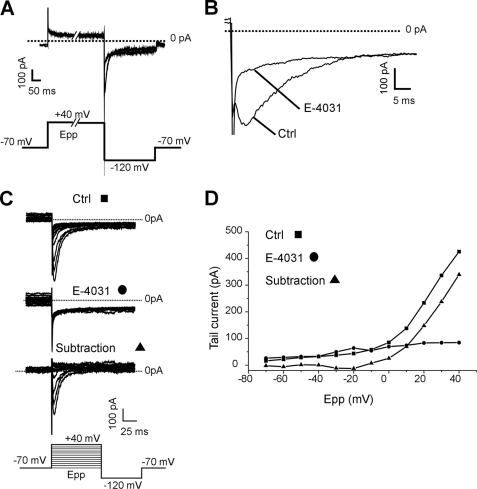
FIGURE 1.
Characterization of hERG currents in K562 cells. A, superimposed tail currents recorded at −120 mV following a 2-s prepulse at +40 mV (Epp) to fully activate hERG channels, in the absence (control) or the presence of E4031 (1 μm). B, detail of the tail currents presented in A. C, families of tail currents recorded following prepulses from −70 to 40 mV in the absence (control) or the presence of E-4031 (1 μm). The bottom current traces represent the graphic subtraction. D, corresponding I/V plots. Tail current amplitudes are plotted against prepulse potential (Epp). Ctrl, control.

