FIGURE 2.
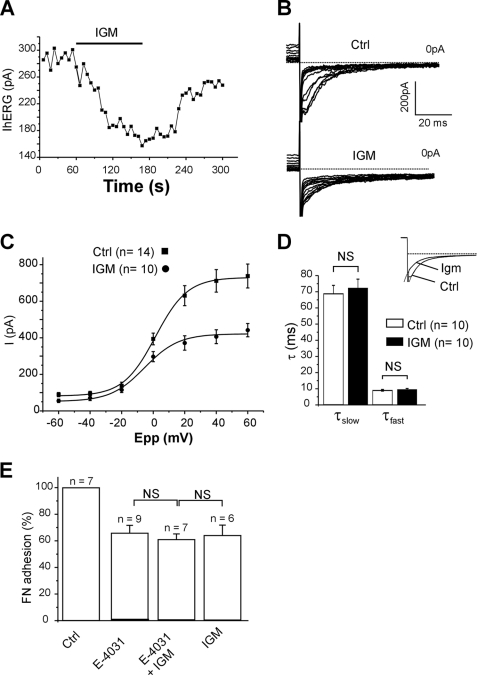
Sigma ligands depress hERG current and cell adhesion to FN in K562 cells. A, time course of hERG current recorded at −120 mV after a 40-mV prepulse in a K562 cell. Igmesine (IGM, left panel, 10 μm) was applied to the external side of the cells during the lap of time represented by the black bar. B, families of hERG currents recorded at −120 mV following prepulses from −70 to 40 mV in a single cell in the absence (upper panel, control) or the presence of igmesine (10 μm, lower panel, IGM). C, corresponding I/V plots. Tail current amplitudes are represented as a function of prepulse potential (Epp) and fitted with a Boltzmann function. D, histogram showing slow and fast deactivating constants at −120 mV in the absence (control) or the presence of igmesine (IGM, 10 μm). Deactivation was fitted with a double-exponential function. The inset shows representative superimposed tail currents recorded before and during igmesine (Igm) application. The values are the means ± S.E. NS, not significant (Student's t test). E, histogram representing the percentage of K562 cells adhering to FN, in control conditions (100%), in the presence of E-4031 (10 μm), E4031 + igmesine (10 μm each), or igmesine alone (10 μm). The values are the means ± S.E. of six to nine independent experiments. NS, not significant (Student's t test). Ctrl, control.

