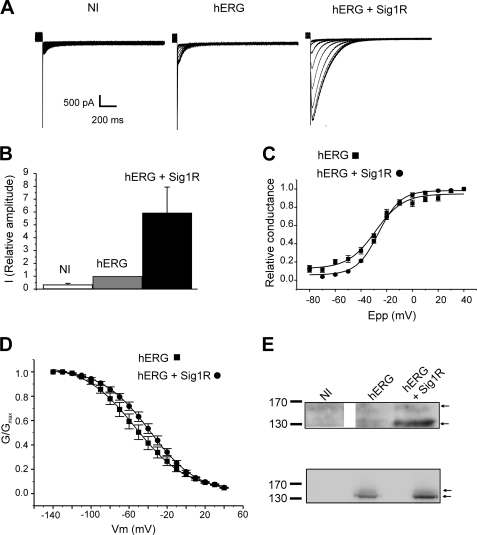
FIGURE 3.
Sig1R expression stimulates hERG currents in Xenopus oocytes. A, families of tail currents recorded in noninjected (NI), hERG cRNA-injected (hERG; 25 pg/oocyte), and hERG + Sig1R cRNA-injected (hERG + Sig1R; 25 pg and 5 ng/oocyte, respectively) oocytes (representative experiment). The voltage protocol is given in the description of Fig. 1C. B, relative current amplitudes at −120 mV in noninjected, hERG cRNA-injected, and hERG + Sig1R cRNA-injected oocytes (arbitrary units, 1 corresponding to the mean current recorded in hERG cRNA injected oocytes). The values are the means ± S.E. of six independent experiments. C, voltage-dependent activation curves in hERG cRNA-injected (black squares) and hERG + Sig1R-cRNA-injected oocytes (black circles). The plots were fitted with a Boltzmann function. The values are the means ± S.E. of six independent experiments. D, voltage-dependent inactivation curves in hERG cRNA-injected (black squares) and hERG + Sig1R cRNA-injected oocytes (black circles). For the detailed voltage protocols, see “Materials and Methods.” The values are the means ± S.E. of n = 8 independent experiments. E, upper panel, Western blots probed with a hERG antibody in noninjected (NI), hERG cRNA-injected (hERG; 25 pg/oocyte), and hERG + Sig1R cRNA-injected (hERG + Sig1R; 25 pg and 5 ng/oocyte, respectively) oocytes. Lower panel, Western blot of the same experiment using an identical concentration for hERG and Sig1R cRNA (15 ng/oocyte). Each Western blot is representative of three independent experiments.

