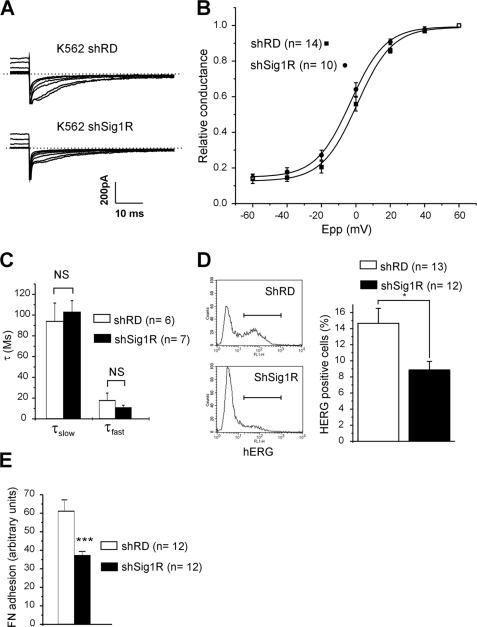
FIGURE 5.
Sig1R silencing reduces hERG current density in K562 cells. A, families of hERG currents recorded in response to the voltage protocol described in the description of Fig. 1C. These representative traces were obtained from shRD K562 (K562 shRD, upper panel) and shSig1R K562 cells (K562 shSig1R, lower panel). B, mean activation plots obtained from shRD K562 (black squares) and shSig1R K562 cells (black circles). The plots were fitted using a Boltzmann function. C, deactivation rate constant of hERG current at −120 mV in shRD K562 (white bars) and shSig1R K562 cells (black bars). Deactivation was fitted with a double-exponential function. The values are the means ± S.E., Student's t test. D, left panel, surface expression of hERG by flow cytometry in shRD and shSig1R K562 cells (representative experiment). Right panel, corresponding histogram. *, p < 0.02, Mann-Whitney. E, FN adhesion in shRD (white bar) and shSig1R (black bar) K562 cells. The values are the means ± S.E. of 12 independent experiments. ***, p < 0,001 (Student's t test). In a single experiment, each value is the mean of three distinct wells.

