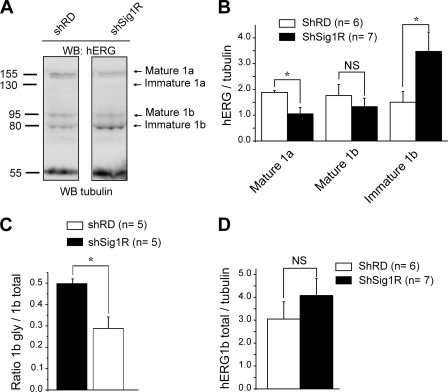
FIGURE 6.
Sig1R silencing alters hERG protein expression in K562 and cells. A, Western blots (WB) probed with the anti-pan hERG or anti-tubulin antibodies, performed in shRD and shSig1R K562 cells. B, histogram of the densitometric analysis of mature and immature hERG isoforms in shRD (white bars) and shSig1R K562 cells (black bars). The values correspond to the densitometric ratio hERG/tubulin. C, trafficking efficiency of hERG1b in shRD and shSig1R (black bar) in K562 cells. Trafficking efficiency is calculated as the densitometric ratio (mature)/(mature + immature). D, histogram showing the total amount of hERG1b in shRD and Sig1R K562 cells. *, p < 0,05 (Mann-Whitney). NS, not significant.

