FIGURE 2.
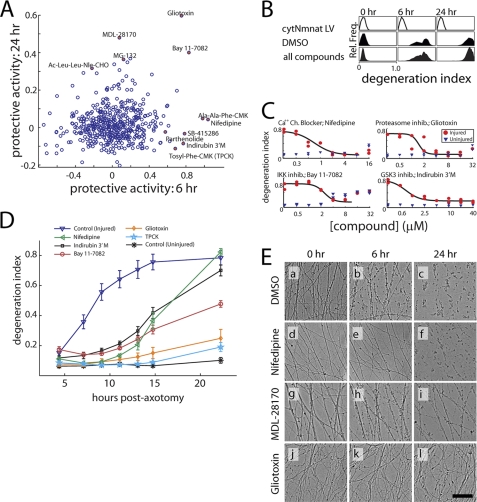
Primary screen results and validation. A, normalized protective activity of all compounds tested (n = 480). The activity of the highest nontoxic dose of each compound is shown. Protective activity is calculated as: 1 = (ΔDIcompound)/(ΔDImedian), where ΔDI is the change in DI from baseline (see text). Validated hits (see text and panel C) are depicted as filled red circles and labeled. See Table 1 for compound activities. B, histograms showing distribution of degeneration indices (before normalization) for controls and compound-treated wells at each time point. Injured controls were treated with DMSO (0.2%), whereas Nmnat1 controls were treated with cytNmnat1 lentivirus. C, dose-response validation curves for representative compounds at 8 h post-axotomy. To monitor toxicity at each concentration, images of proximal/uninjured axons were acquired within each well. D, axon fragmentation time course with selected compounds. For 5 selected compounds, axon degeneration was measured at 7 time points post-axotomy in the presence of a predetermined optimal dose. All compounds tested suppressed axon degeneration at early time points, but after 22 h only some treatments resulted in reduced fragmentation. Nifedipine = calcium channel blocker, 10 μm; indirubin 3′-monoxime = GSK3 inhibitor, 5 μm; Bay 11-7082 = IKK inhibitor, 4 μm; gliotoxin = proteasome inhibitor, 2 μm; TPCK = protease inhibitor, 28 μm. E, heterogeneity in axon protection phenotype. Calcium channel inhibitor nifedipine (panels d, e, and f) protected axons from swelling at 6 h but did not block fragmentation at 24 h. Calpain inhibitor MDL-28170 did not block axon swellings at 6 h (h) but blocked the majority of axon fragmentation at 24 h (i). Proteasome inhibitor gliotoxin suppressed both swelling and fragmentation at 6 (k) and 24 (l) h post-injury. Scale bar = 100 μm.

