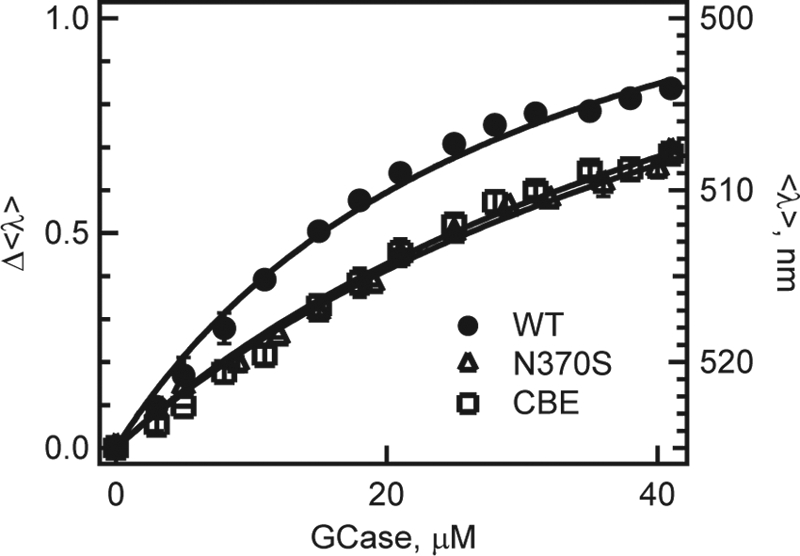
FIGURE 2.

Titration curves of N370S (△) and CBE-treated GCase (□) obtained from mean spectral wavelength (<λ>) of Dns136-α-syn at pH 5.5. For comparison, WT (●) data also are shown. Left and right axis denotes normalized (Δ<λ>) and absolute (<λ>) wavelength changes, respectively. Error bars (comparable to symbol size) indicate standard deviations for at least two independent measurements. Fits are shown as lines.
