FIGURE 5.
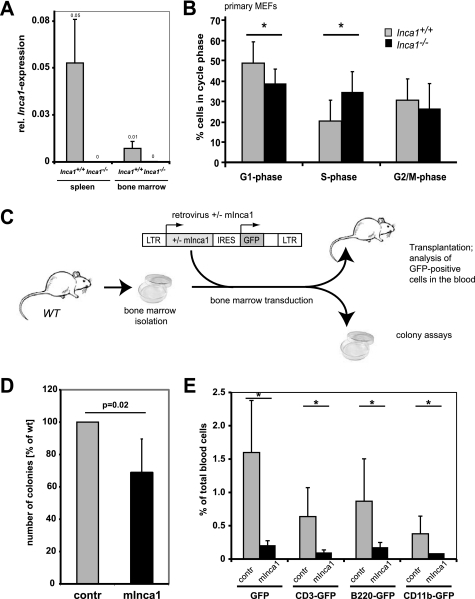
Inca1 represses growth in primary MEFs and bone marrow cells. A, real time RT-PCR using a primer/probe combination specific for the region of the Inca1 mRNA, which was replaced by the knock-out construct, revealed complete loss of Inca1 mRNA in bone marrow and spleen of Inca1−/−mice. The expression of Inca1 was normalized to GAPDH expression. B, cell cycle analysis of Inca1+/+ and Inca1−/− MEFs. Cells were starved for 72 h in 0.1% FCS and analyzed for cell cycle distribution by propidium iodide staining. The number of Inca1−/− cells in G1-phase was significantly decreased (p = 0.03, t test), whereas the number of Inca1−/− cells in S-phase increased compared with Inca1+/+ cells in low serum condition (p = 0.01, t test). The data show mean ± S.D. of four wild type and two Inca1−/− MEF preparations, each analyzed independently at least two times. C, schematic overview about the performed transduction and transplantation experiments. Bone marrow isolated from wild type (WT) mice was retrovirally transduced with either empty vector or with mInca1-IRES-GFP. Equal numbers of positive cells were transplanted into lethally irradiated recipients, which were then subjected to different analyses. D, colony formation assay of wild type bone marrow cells, which were retrovirally transduced with empty vector (contr) or murine Inca1-cDNA (mInca1) (n = 3). Bone marrow transduced with mInca1 formed a significantly decreased number of colonies compared with the empty vector transduced cells (p = 0.02). Shown here are the results of three independent experiments in triplicate as mean ± S.D. E, fraction of wild type bone marrow cells that were transduced with empty vector (contr) or mInca1 was determined by FACS analysis of GFP-positive cells in the blood of transplanted mice 8 weeks after transplantation. The fraction of GFP-positive cells was significantly lower in the blood of recipients transplanted with mInca1-transduced bone marrow cells in all lineages (*, p < 0.01).

