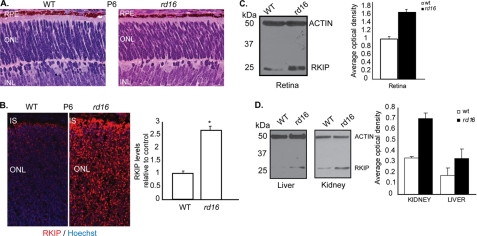
FIGURE 3.
Cep290 regulates intracellular levels of Rkip. A, histological analysis of retinal sections of P6 WT and rd16 mice. RPE, retinal pigment epithelium; ONL, outer nuclear layer; INL, inner nuclear layer. B, increased endogenous levels of Rkip were detected in P6 rd16 retinas by immunofluorescence using anti-Rkip antibody (red). Nuclei are stained with Hoechst (blue). Right panel shows graphical representation of the Rkip signal in arbitrary fluorescent units. Data from three different animals in each group are represented mean ± S.D. (*, p = 0.03; paired t test). C, immunoblot analysis revealed increased Rkip levels in P6 rd16 retinal lysates. The histogram shows quantitative analysis of the optical density of the Rkip-immunoreactive band relative to actin (control). Data represent average ± S.D. of at least three independent experiments (*, p = 0.002; paired t test). D, immunoblot analysis and quantification of Rkip levels in P6 rd16 kidney and liver lysates. Actin was used as loading control. Lower panel shows statistically significant differences in Rkip levels in kidney (p = 0.00003) and liver (p = 0.001).

