
FIGURE 7.
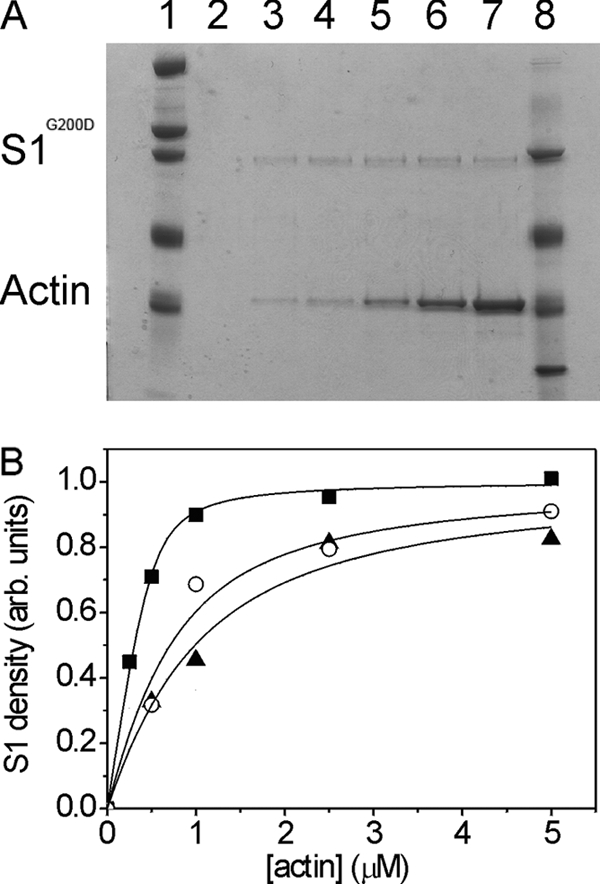
Determination of actin affinity in the presence of ADP (24). The affinity of S1 for actin was characterized with the co-sedimentation method (see “Experimental Procedures”). A, representative SDS-polyacrylamide gel of the pellets from experiments where S1G200D (100 nm) was mixed with various actin concentrations (0, 0.25, 0.5, 1.0, 2.5, and 5 μm (lanes 2, 3, 4, 5, 6, and 7, respectively)) in the presence of ADP (10 mm). Lanes 1 and 8 contain molecular weight markers. B, the densities of the myosin S1 bands as a function of [actin] shown for wild-type IFI (○) and the two point mutants S1G200D (■) and S1A261T (▴). The fits for these samples gave a value of KDA = 62 nm (S1G200D), KDA = 684 nm (S1A261T), and KDA = 446 nm (IFI-WT). arb. units, arbitrary units.