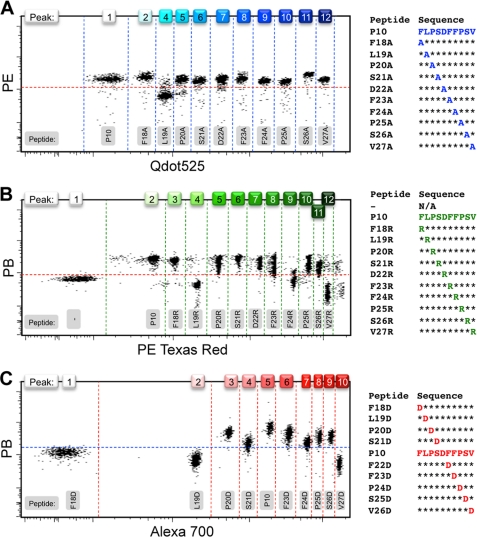
FIGURE 3.
Alanine, arginine, and aspartic acid scans on multiple colored beads. Individual bead populations were loaded with HLA-A*02:01 molecules that were ligand-exchanged with peptide derivatives of the parent peptide FLPSDFFPSV (P10) in the form of an alanine scan for the Yellow set, where fluorescent peak 3 was omitted because it overlapped with peak 2 too much for them to be clearly distinguishable (A), an arginine scan for the Pink set (B), and an aspartic acid scan for the Blue set (C). MHC stabilization was probed with anti-β2m conjugated with either PB or PE. The choice of color schemes of the bead intensity was deliberately based not on physical appearance of the beads but on the fluorescent emission properties. Dotted lines were drawn in arbitrarily after analysis to serve as visual aids and do not represent specific gates.

