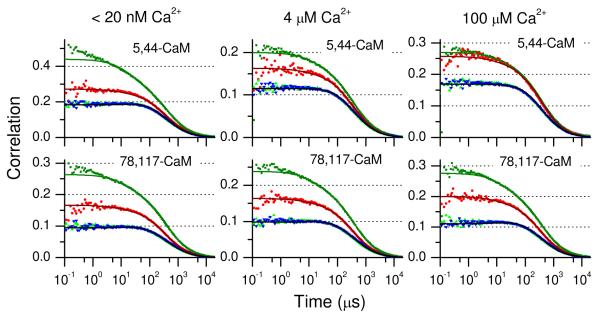
Figure 3.
Correlation functions for CaM-AF488-Atto 740: GGG(τ) (green squares), GRR(τ) (red circles), GGR(τ) (green triangles), and GRG(τ) (blue inverted triangles). The solid lines show global fits where the transit times for GGG(τ), GGR(τ), and GRG(τ) were linked, and the initial amplitudes were allowed to vary independently. Fitting parameters are in Table 2. The top panels show the correlations for 5,44-CaM and the lower panels show the correlations for 78-117-CaM. Left: apoCaM (Ca2+ concentration <20 nM); Center: Ca2+ concentration 4 μM; Right: holoCaM (Ca2+ concentration 100 μM).

