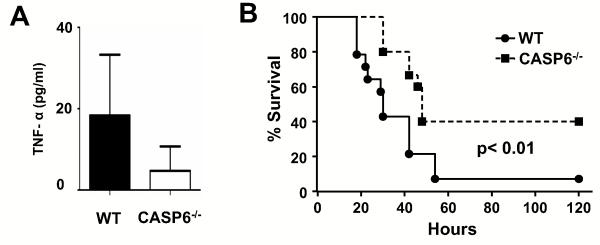
Figure 8. CASP-6−/− mice have less BAL TNF-α production and lower mortality in polymicrobial sepsis CLP model.
(A) TNF-α level in BAL fluid. Samples were obtained 18h after CLP from CASP-6−/− (n = 8) and WT mice (n = 8). Data are represented as mean ± SE. (B) Survival after CLP. CASP-6−/− (n =15) and WT (n = 14) underwent CLP and were monitored for survival. The data are shown as a Kaplan-Meier plot with survival on the Y axis and time post CLP on the x axis.

