
Figure 13.
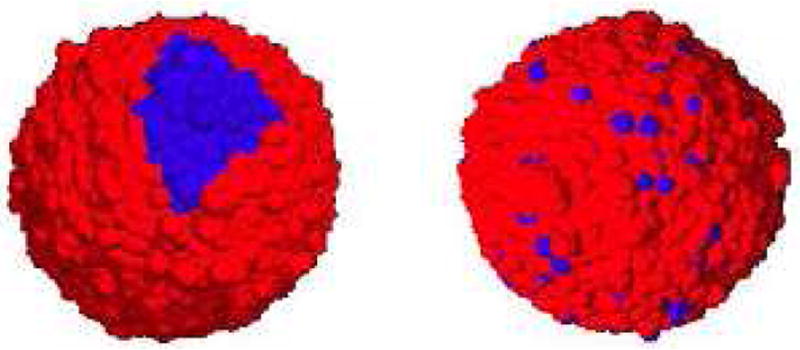
Initial images of two-strain tumors, as adapted from Ref. [13]. The resistant subpolulation is localized (left panel) and scattered (right panel). The blue cells of each tumor belong to the resistant subpopulation, while the blues ones belong to the sensitive subpopoluation.