
Figure 14.
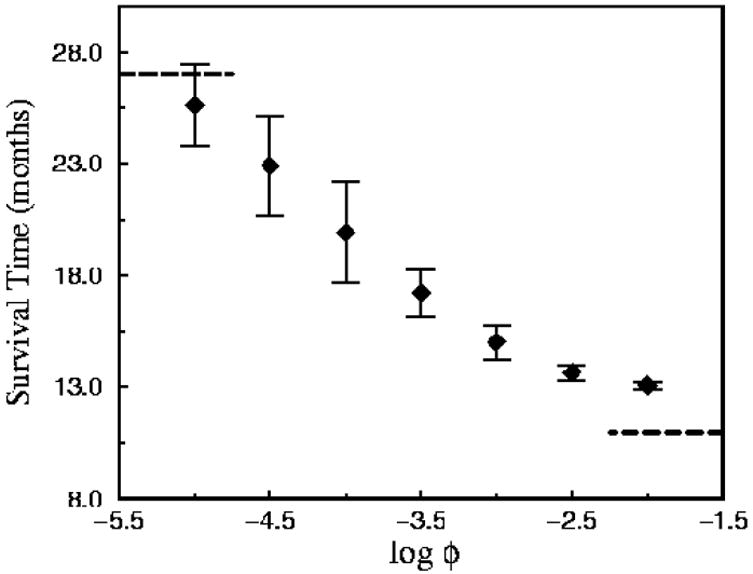
Survival times associated with continuously mutating tumors, as adapted from Ref. [13]. This figure depicts data of the mean survival time (with error bars) as a function of ϕ, the expected fraction of tumor cells that mutate at each instance of treatment.