
Figure 8.
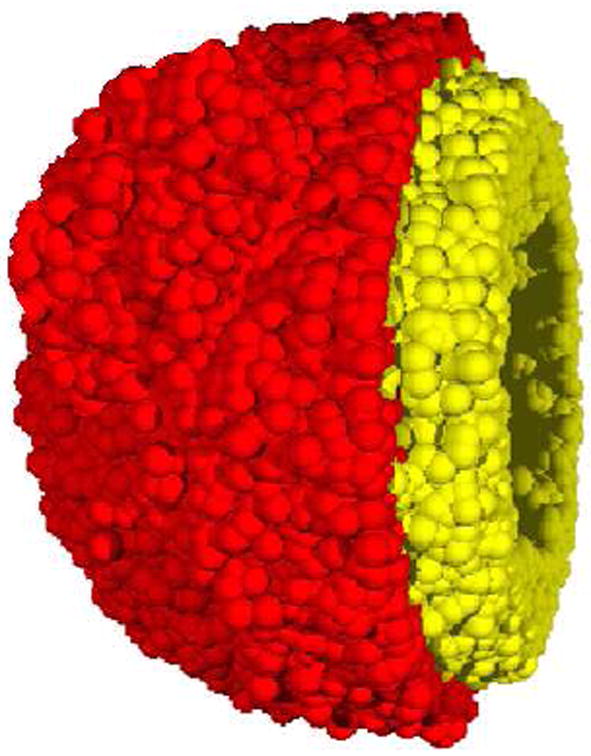
A cut-away view a simulated tumor generated from the minimalist CA algorithm [11]. The inner necrotic core is not depicted in this view. The yellow (light gray) region is comprised of nonproliferative cells and the red (dark gray) shell depicts the proliferative cells.