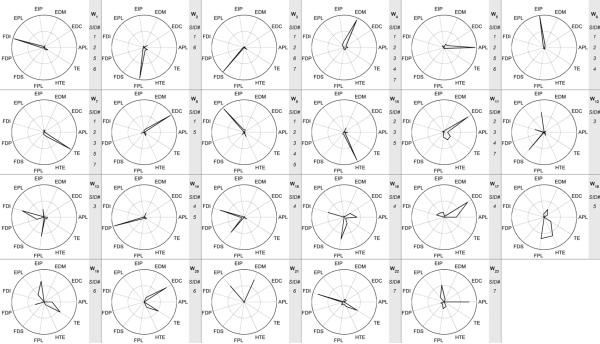
Figure 10.
The estimated synergies (using the mean square error method) defining the predictive framework for all subjects are represented as radial plots in each of the 23 boxes, where each muscle's representation to the synergy is given by the distance from the center. The synergies were aligned to determine which synergies were shared across the population versus which were subject specific. The gray box to the right of each plot shows the synergy number and the SIDs of which subjects shared that synergy. Many synergies, such as W1, W3, W4, W5, W6, W7, W9 and W11 were exhibited across the predictive frameworks of several subjects, while others such as W15–W23 were subject specific.

