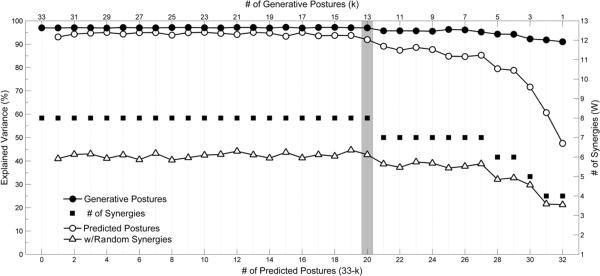
Figure 8.
Each line curve represents a separate phase of the predictive NMF analysis performed on one characteristic subject. The line curves illustrate the variance of the EMG data sets of the generative (`●' curve,left y-axis, top x-axis) and predicted (`◯' and `Δ'curves, left y-axis, bottom x-axis) ASL posture sets explained by the estimated synergies, and the corresponding number of estimated synergies (`∎' plot, right y-axis, top x-axis). The plots are aligned such that the n synergies used to estimate k generative postures were the same used to predict 33-k predicted postures. Above a knee, the predictive power of the estimated synergies did not significantly increase. This knee kmin (designated by the column highlighted in gray) was chosen such that the estimated synergies had a predictive power of at least 90%. kmin for this subject was 13 generative postures, corresponding to nmin of 8 synergies. For comparison, the predictive power of nmin = 8 random synergies was approximately 40%.

