
Figure 3.
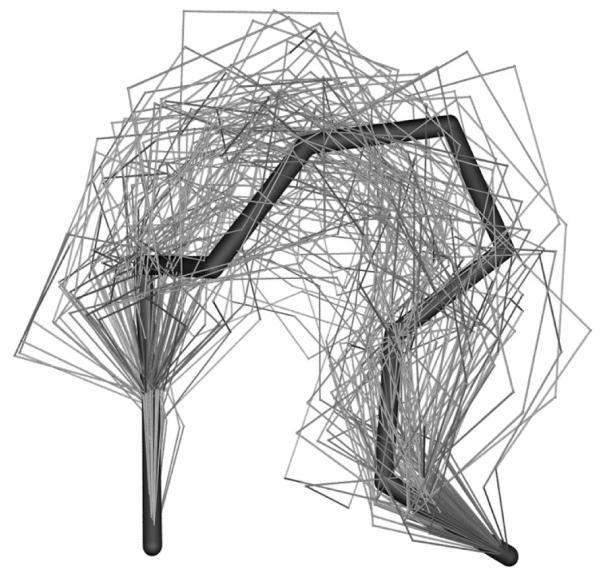
Loop Structure of 2act (198-205) produced by the local move MC method at 5000K and followed by clustering to generate 100 representative conformations. Black stick represents the crystal loop structure, and gray wires represent the 100 representative loop conformations.