Figure 2.
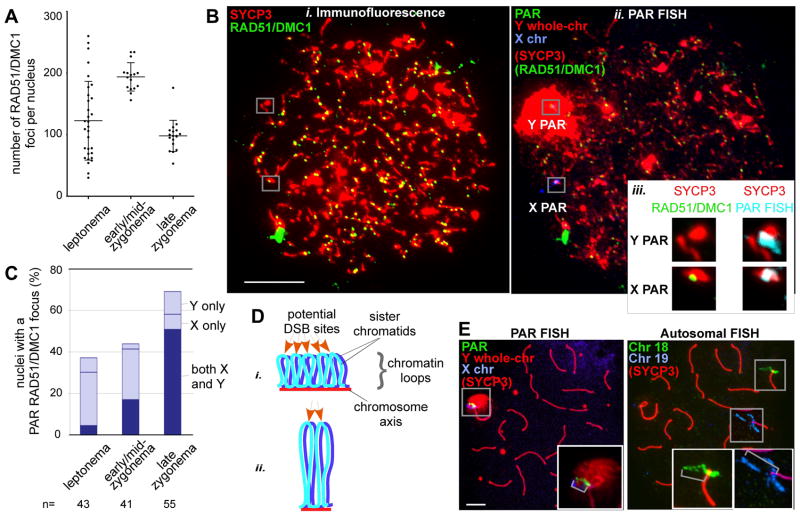
Distinct temporal and structural properties of the PAR. A. Nucleus-wide RAD51/DMC1 foci in spermatocytes (bars = mean±SD). B. Assay for PAR DSB formation. IF against RAD51/DMC1 and SYCP3 (i) and FISH (ii) with probes shown in Figure 1Ai on a leptotene spermatocyte nucleus. Scale bar, 10 μm. iii, Zoom-ins of Y and X PARs from i (29), and an overlay of the PAR FISH signal with SYCP3 (left), here with a RAD51/DMC1 focus only on the X PAR. C. Nuclei (%) with one or two PAR RAD51/DMC1 foci. D. Axis/loop segments as a determinant of DSB potential (after ref. 15). Only one homolog is shown. DNA organized on a longer axis into more and smaller loops (i) has more DSB potential than if the same DNA is organized on a shorter axis into fewer and larger loops (ii). E. Examples of chromatin extension (grey brackets in insets), see also Table 1. Scale bar, 5 μm.

