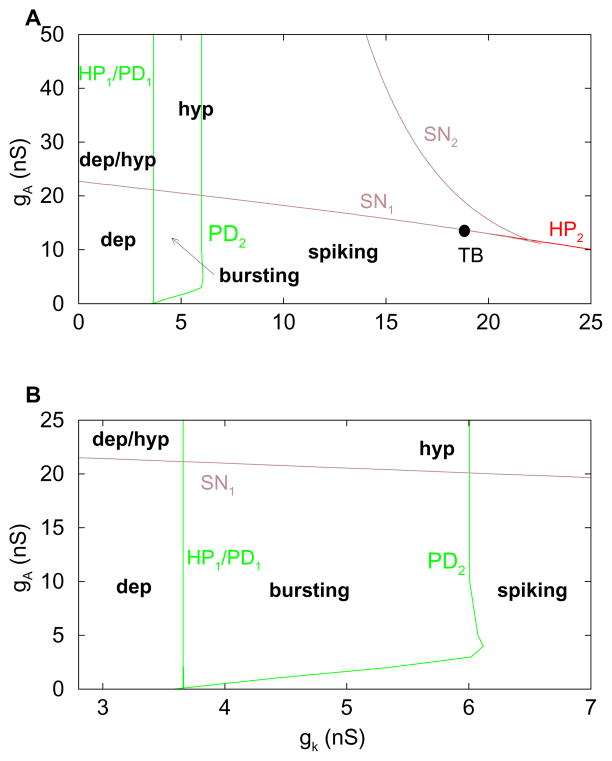
Figure 3.
(A) Two-parameter bifurcation diagram in the parameters gK and gA, with C = 2 pF. (B) Blowup of panel A, highlighting the bursting region. The label SN represents a saddle node bifurcation. The label TB represents a codimension-2 Takens-Bogdanov bifurcation. The system behaviors are in bold: bursting=periodic bursting, dep=depolarized steady state, hyp=hyperpolarized steady state, dep/hyp=bistable region.

