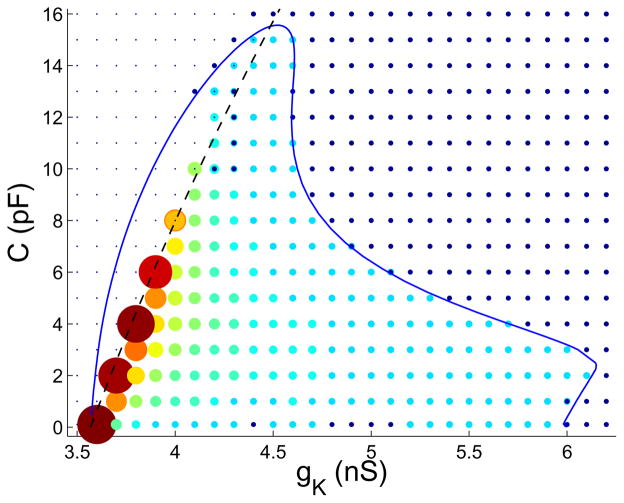
Figure 6.
Number of spikes per burst for a grid of gK and C values (gA = 4 nS). Single points represent steady states, and small dark circles represent continuous spiking. Larger circles with colors ranging from light blue to red represent bursting. The larger the circle, the greater the number of spikes per burst. The minimum number of spikes is 2 (small, light blue), and the maximum is 62 (large, red). Circles with points in the middle represent bistable dynamics.

