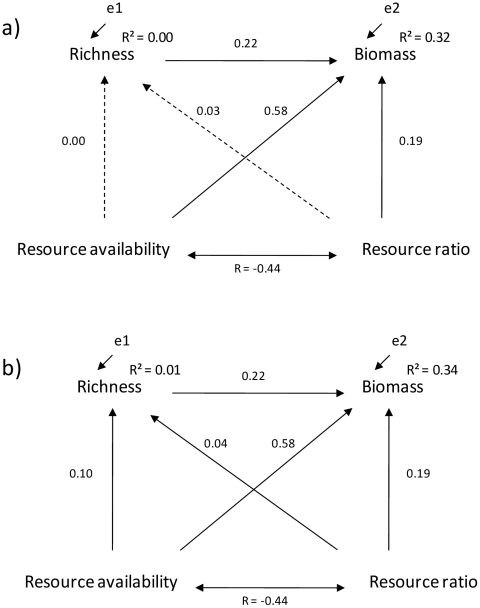
Figure 5. The results of a Structural Equation Modeling for phytoplankton data with (5a) or without (5b) best model selection.
SEM was conducted to test whether covariance among variables collected from 100 lakes could be produced by a covariance matrix set a priori (shown in Fig. 1c). The coefficients next to arrows represent the standard deviation change between variables. R2 values indicate the amount of explained variation in species richness and phytoplankton biomass. The correlation between the resource supply and resource ratio (R) was −0.44. Dashed lines denote non-significant relationships.

