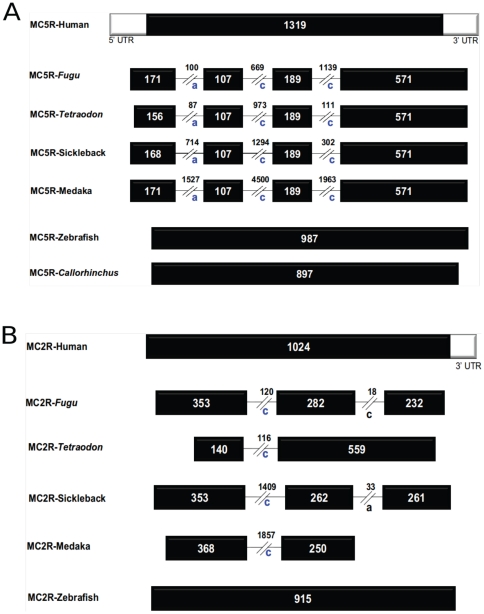
Figure 3. Exon-intron architecture of selected MC receptors.
A. Gene structure of MC5 receptors. B. Gene structure of MC2 receptors. Black bars represent exons in coding regions and white bars represent exons in UTR regions. Introns are represented by black lines. Size of introns and exons are given in values in respective introns and exons. Intron phasing is marked by a–c, indicating intron phasing according to their location after the first, second, or third base of the corresponding codon, respectively. The intron phasing of conserved intron is marked by blue color while black color for non-conserved introns as found in case of MC2Rs from Takifugu and stickleback.

