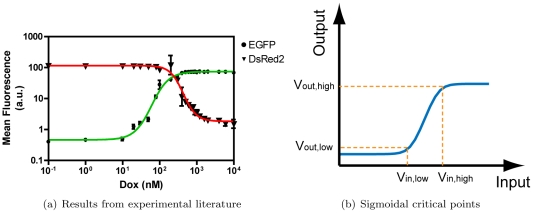
Figure 4. Transfer function experiments and requirements.
Model and parameters are based on sigmoidal behaviors documented in the experimental literature, as in the graph from [30] shown in (a), showing sigmoidal responses of green and red fluorescence proteins upon Doxycycline (Dox) induction. In this network implemented in AINV15 cells, Dox binds rtTA and activates expression from the TRE promoter of an Enhanced Green Fluorescence Protein and mammalian-optimized LacI repressor. In turn, LacI represses production of DsRed2 from a Hef1a promoter engineered with lac operators. (b) Every sigmoidal curve has an input concentration window that results in large output variations. The curve shown is for transcriptional activation. Repression is represented by an analogous inverse sigmoidal curve.

