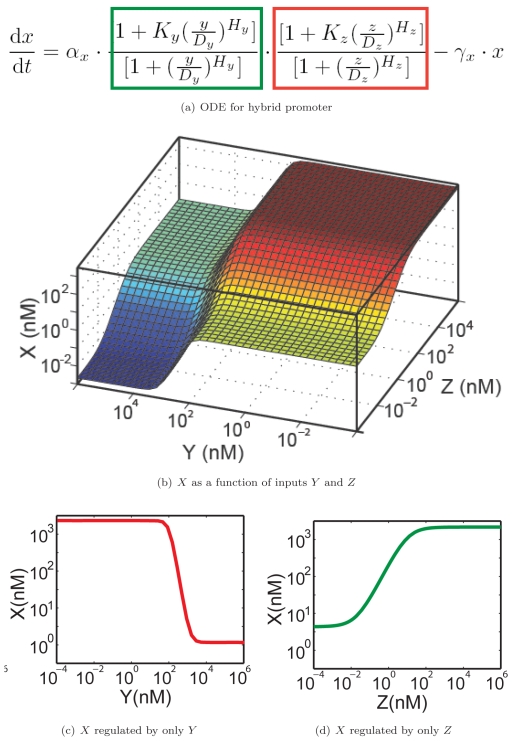
Figure 5. Transfer function models.
Mathematical representation of the functional unit in Figure 3, via (a) ordinary differential equation that describes the kinetics of the transcription factor  . (b) The 3D profile of protein
  as a function of inputs
  and
and  . (c,d) Typical input-output relations of the functional unit when modulating only one of the inputs.

