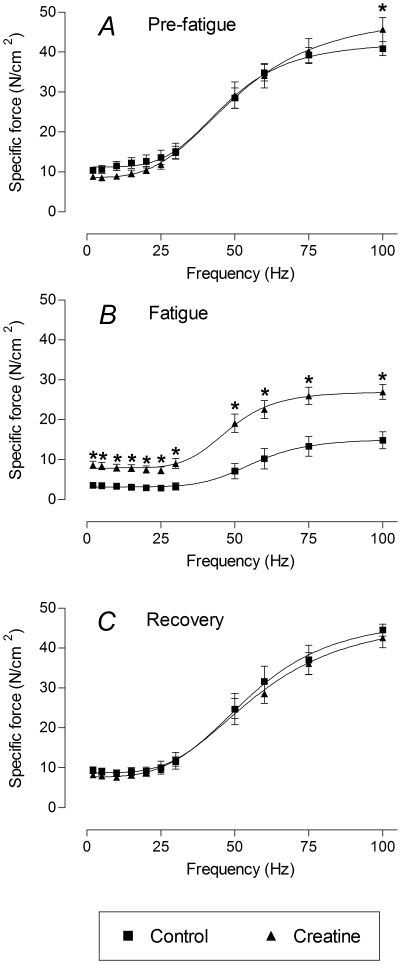
Figure 2. Force-frequency curves for EDL muscles before and after creatine treatment.
Each graph shows the force-frequency curves under control and creatine-treated conditions. In the pre-fatigue state (A), creatine significantly increased the force produced at 100 Hz. In the fatigued state (B), creatine incubation significantly increased the force produced at every frequency. In the recovered state (C), creatine had no significant effect on the force at any frequency. Statistically significant differences are indicated by “*” (P<0.05). Tests for significance at each frequency were conducted using Bonferroni multiple comparison post-tests following two-way repeated measures ANOVA (GraphPad Prism).

