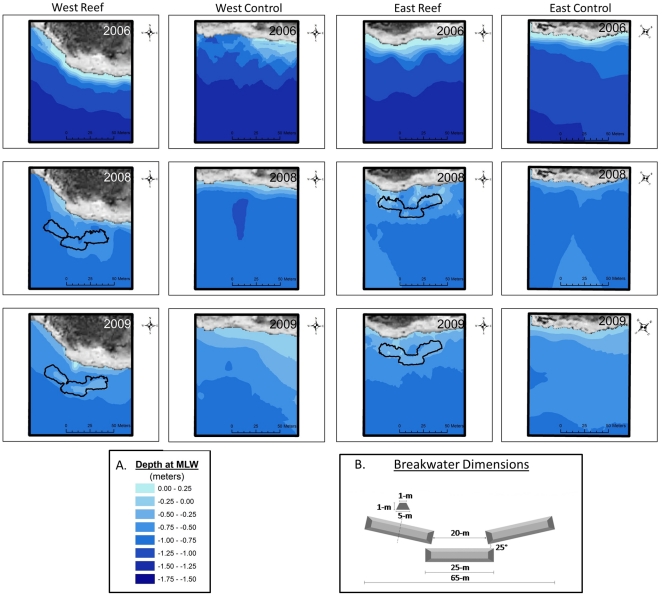
Figure 3. Bathymetry Plots from the Western Experimental Breakwater Reef and Control Treatments at Point aux Pins.
The top row of 2006 plots was approximately one year prior to construction. The 2008 and 2009 plots are from one and two years post construction. Depth gradients are shown in inset (A). A schematic of the initial reef shape is depicted in (B). The crest width of each reef was approximately 1-m at MLLW.

