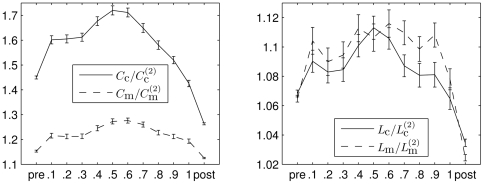
Figure 8. Evolving normalized network properties averaged over 100 epileptic seizures.
Mean values of  and
and  (left) as well as
  and
and  (right) averaged separately for pre-seizure, discretized seizure, and post-seizure time periods of 100 epileptic seizures. All error bars indicate standard error of the mean. Lines are for eye-guidance only.

