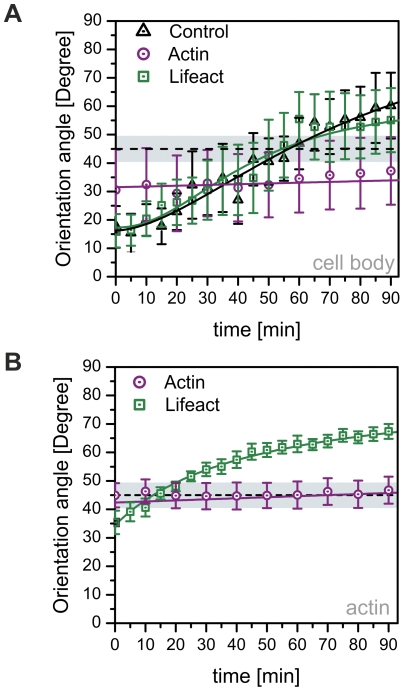
Figure 3. Quantification of cell body and microfilament reorientation kinetics in EGFP-Lifeact and EYFP-actin transfected cells.
Average orientation of the (A) cell body and the (B) actin stress fibers with respect to the direction of applied strain over a time period of 90 minutes. Experimental data are represented by the symbols; the solid line indicates a fit of a sigmoidal function to the data. EYFP-actin transfected cells display considerably altered reorientation behavior compared to control and EGFP-Lifeact cells. Dashed line and surrounding gray box indicate regime of indifferent orientation. Data are averages from six cells taken from independent experiments ± s.e.m.

