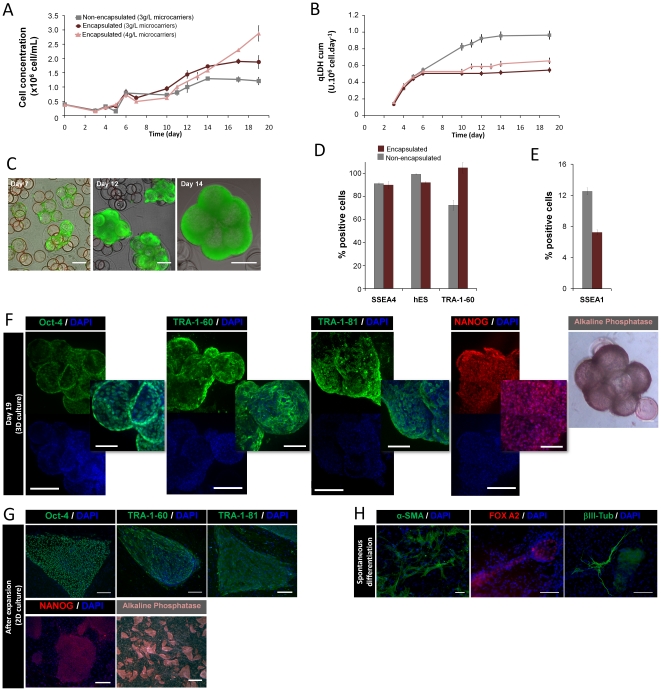
Figure 3. Effect of alginate microencapsulation on the expansion of hESCs immobilized on microcarriers.
hESCs were immobilized on Matrigel-coated microcarriers (2 g/L) and encapsulated at day 6. Before microencapsulation empty coated microcarriers (1 g/L and 2 g/L) were added. Non-encapsulated (grey) and encapsulated hESCs using 3 g/L (purple) and 4 g/L (pink) of microcarriers were cultured in spinner vessels. (A) Growth curve expressed in terms of cell number per volume of medium. Error bars denote SD of 3 measurements. (B) Cumulative values of specific rates of LDH release during culture time. Error bars denote SD of 3 measurements. (C) Phase contrast and fluorescence images of encapsulated hESC cultures (on 4 g/L microcarriers) at days 7, 12 and 14. Viability analysis of cultures stained with fluoresceine diacetate (FDA-live cells, green) and propidium iodide (PI- dead cells, red). Scale bar: 200 µm. (D–H) Characterization of encapsulated hESCs immobilized on microcarriers expanded in spinner vessels: (D) Flow cytometry analysis of non-encapsulated (grey bars) and encapsulated (purple bars) hESCs immobilized on microcarriers at the end of the expansion process - percentage of SSEA-4, TRA-1-60 and hES-CellectTM (hES) and (E) SSEA-1 positive cells in relation to the 2D control culture; error bars represent SD of 2 measurements. (F) Confocal images of Oct-4, TRA-1-60, TRA-1-81 and NANOG labeling and phase contrast pictures of alkaline phosphatase (AP) activity at day 19 of encapsulated 3D culture. Nuclei were labeled with DAPI (blue). Scale bar: 200 µm, merge and phase contrast images 100 µm. (G) Immunofluorescence images of Oct-4, TRA-1-60, TRA-1-81 and NANOG labeling after expansion (2D culture). Nuclei were labeled with DAPI (blue). Scale bars: 200 µm and 1 mm for immunofluorescence and phase contrast images, respectively. (H) In vitro pluripotency analysis. Microcapsules were dissolved and hESCs were detached from the microcarriers and transferred to a monolayer of inactivated hFF. At confluence, colonies were dissociated and hESCs were able to form embryoid bodies (EBs) in non-adherent conditions and differentiated into cells from all three germ layers. Fluorescence images of differentiated cultures labeled for α–SMA (α smooth muscle actin, mesoderm), FOX-A2 (Forkheadbox A2, endoderm) and βIII-Tub (β tubulin type III, ectoderm). Nuclei were stained with DAPI (blue). Scale bar: 100 µm.

