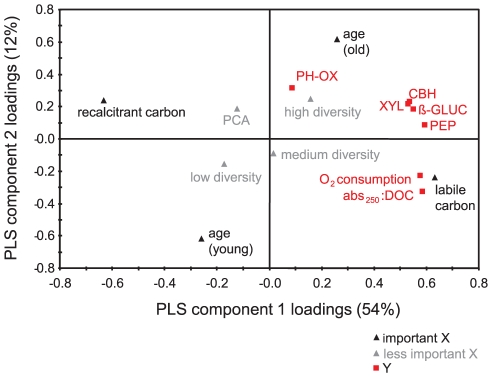
Figure 3. PLS loading plot of community functioning.
The plot depicts the correlation structure between X and Y and can be interpreted by drawing a line from any Y-variable through the origin and by identifying the position of orthogonal projections of the X-variables. Factors (X) close to and on the same side of the origin (0,0) are positively related to the response (Y), and factors more distant from the origin are more important. Y-variables close to each other are correlated. Factors are separated according to their importance (VIP). Abbreviations: CBH: cellobiohydrolase, ß-GLUC: beta-glucosidase, XYL: xylosidase, PEP: leucine-aminopeptidase, PH-OX: phenoloxidase, abs250:DOC: change in the ratio of absorbance at 250 nm to dissolved organic carbon concentration over 10 days, PCA: scores on the first axis of Principal Component Analysis of the T-RFLP results.

