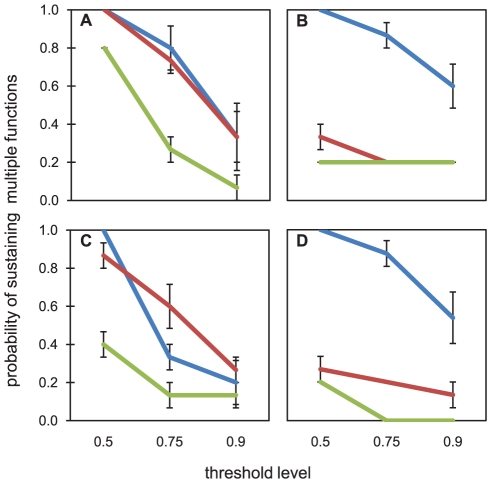
Figure 4. Probabilities for all 5 studied enzymes to be active above a threshold level of 0.5, 0.75 or 0.9 of the maximum activities.
Shown are the probabilities for bioreactors fed with labile (A and C) and recalcitrant (B and D) organic carbon. Differences in the likelihood of sustaining joint functioning for young (A and B) and old (C and D) biofilms are shown. Blue lines represent the high diversity treatment, red lines the medium diversity treatment and the green lines the low diversity treatment. Error bars indicate s.e.m. N = 3.

