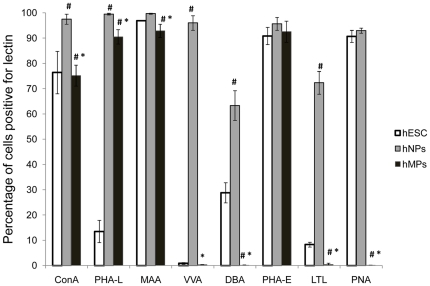
Figure 3. Quantification of lectin binding in hESC, hNP and hMP cell surfaces with 8 different lectins.
The percent of cells with specific carbohydrate expression was determined by flow cytometry using 8 different lectins. Each of the 3 cell types were separately stained with one of 8 lectins. The data is represented as average +/− SD of 4 independent assays of hESCs, hNP cells and hMP cells. Means with different letters are significantly different, # indicates p<0.05 compared to hESCs and * indicates p<0.05 compared to hNP cells.

