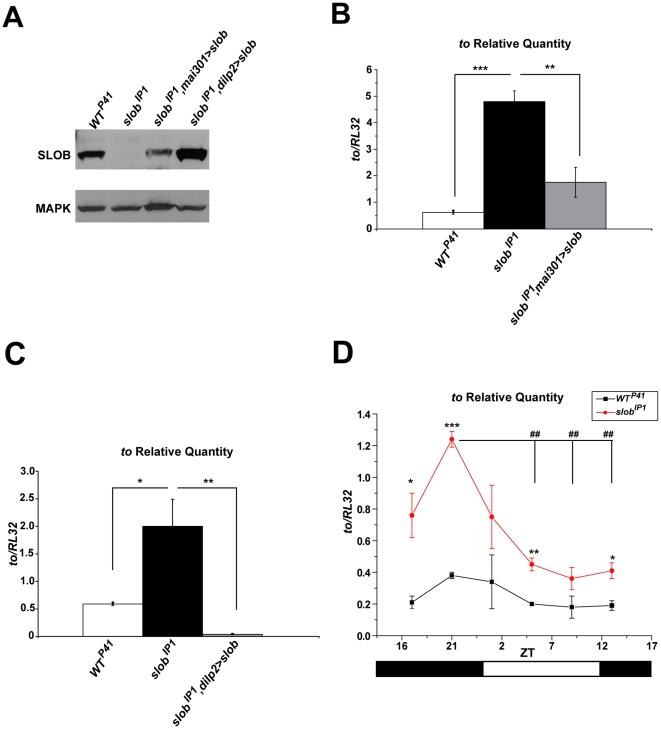
Figure 1. to mRNA levels are increased in slobIP1 fly heads but still cycle.
A, Western blot demonstrating rescue of SLOB expression in fly heads using two separate drivers for mNSCs in the slobIP1 background. B , C , to mRNA levels in fly heads were measured by qPCR. to relative transcript levels are increased in slobIP1 flies and rescued by targeted expression of slob in mNSCs. D , to transcript levels cycle in WTP41 and slobIP1 fly heads. Zeitgeber time (ZT) is plotted on the X axis; the white and black bars represent “lights on” and “lights off”, respectively. Each graph is a summary of a minimum of three independent experiments (mean ± SEM). For comparisons between fly lines, * indicates p<0.05, ** indicates p<0.01, *** indicates p<0.001; for comparisons between ZT points within one fly line, ## indicates p<0.01, One-way ANOVA with Bonferroni post-test.

