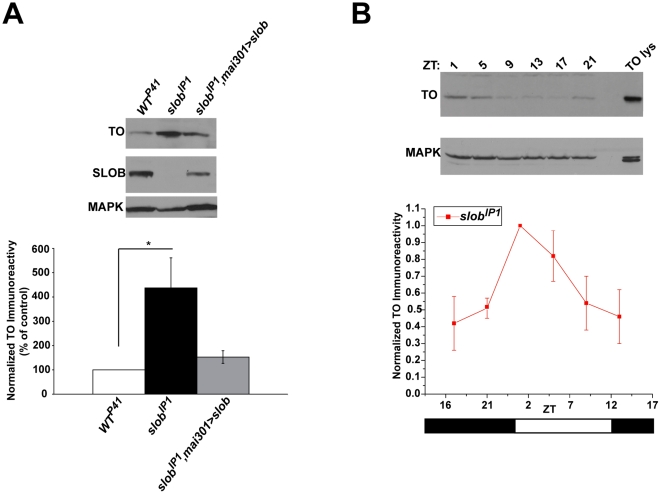
Figure 2. TO protein levels are increased in slobIP1 fly heads but still cycle.
TO protein levels in fly heads were measured by Western blot analysis and normalized to MAPK levels. A , Representative Western blot showing an increase in TO expression in slobIP1 fly heads compared to WTP41 fly heads. TO levels are rescued in slobIP1,mai301>slob fly heads. The graph is a summary of four independent experiments (mean ± SEM). * indicates p<0.05, One-way ANOVA with Bonferroni post-test. B , Representative Western blot showing that TO levels cycle in slobIP1 fly heads. Zeitgeber time (ZT) is plotted on the X axis; the white and black bars represent “lights on” and “lights off”, respectively. The graph is a summary of three independent experiments (mean ± SEM).

