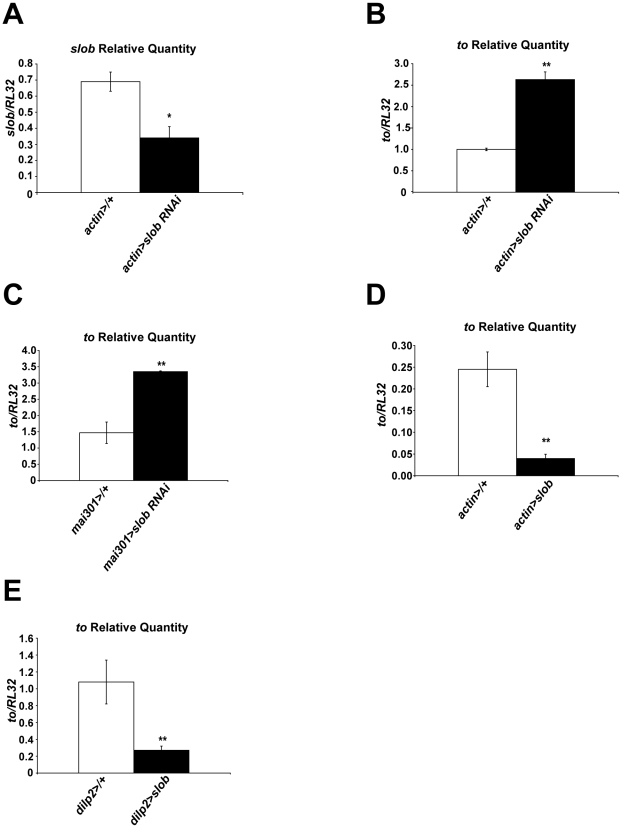
Figure 3. to mRNA levels are dependent on expression of SLOB.
Slob and to levels in fly heads were measured by qPCR. A , Relative slob transcript levels are decreased in heads of flies in which SLOB expression was knocked down ubiquitously using RNAi. B, Relative to transcript levels are increased in heads of flies in which SLOB expression was knocked down ubiquitously using RNAi. C , Relative to transcript levels are increased in heads of flies in which SLOB expression was knocked down in mNSCs using RNAi. D , Relative to transcript levels are decreased in heads of flies in which there is ubiquitous overexpression of SLOB. E , Relative to transcript levels are decreased in heads of flies in which SLOB was overexpressed exclusively in mNSCs. Each graph is a summary of a minimum of three independent experiments (mean ± SEM). * indicates p<0.05, ** indicates p<0.01, Student's t-test.

