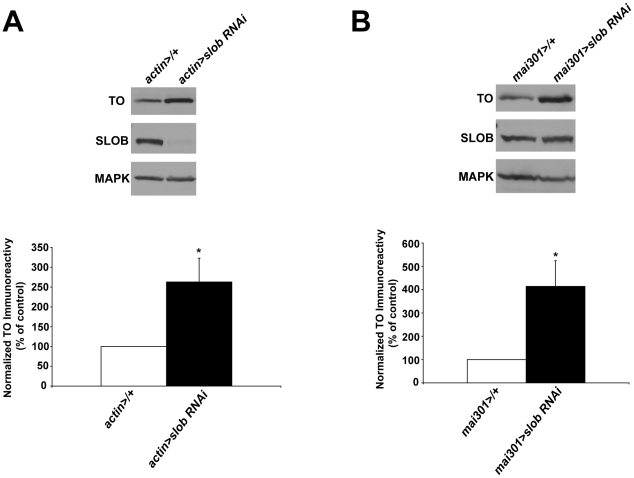
Figure 4. TO protein levels are dependent on expression of SLOB.
TO protein levels in fly heads were measured by Western blot analysis and normalized to MAPK levels. A , Representative Western blot showing increased TO in heads of flies in which SLOB expression was knocked down ubiquitously using RNAi. The graph is a summary of five independent experiments (mean ± SEM). B , Representative Western blot showing increased TO in heads of flies in which SLOB expression was knocked down in mNSCs using RNAi. The graph is a summary of six independent experiments (mean ± SEM). * indicates p<0.05, One-way ANOVA with Bonferroni post-test.

