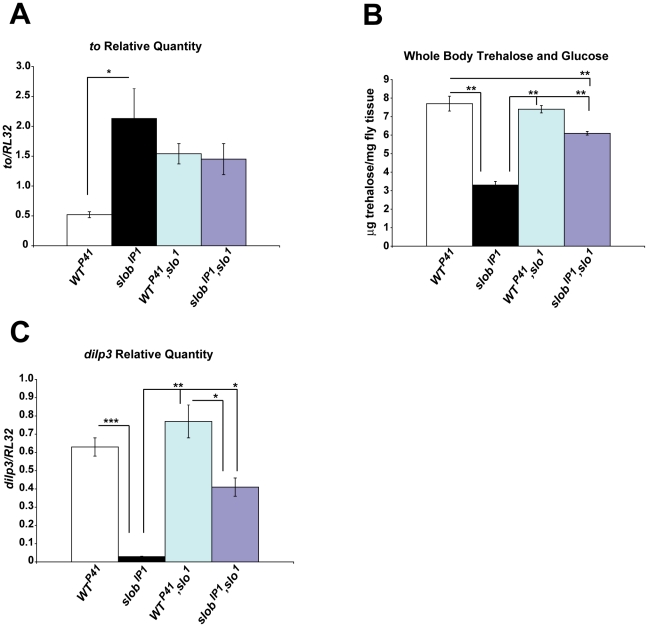
Figure 7. The effects of SLOB on gene expression and metabolism require SLO.
A, Relative to transcript levels in fly heads were measured by qPCR. WTP41,slo1 and slobIP1,slo1 express equivalent amount of to in fly heads. B, Whole body trehalose plus glucose levels were measured in flies after fasting. Stored trehalose plus glucose levels are significantly decreased in slobIP1 flies compared to WTP41,slo1 or slobIP1,slo1 flies. C, The reduction in dilp3 levels is attenuated in slobIP1,slo1 fly heads. Results are a summary of a minimum of three (A, C) or 13 samples (B) (mean ± SEM). * indicates p<0.05, ** indicates p<0.01, *** indicates p<0.001, One-way ANOVA with Bonferroni post-test.

